The Six-Hour Blind Spot in the Emergency Department: Why Routine Blood Counts Are Not Enough
When a three-year-old child arrives in the pediatric emergency department with a sudden high fever of 39.5 degrees Celsius, or an elderly postoperative patient develops unexplained chills in the surgical ward, the attending physician faces an immediate clinical dilemma: Is this a self-limiting viral infection, a localized bacterial infection, or the early stage of life-threatening sepsis?
For decades, the standard frontline screening tool has been the routine Complete Blood Count (CBC) with a 3-part or 5-part leukocyte differential. While indispensable, the white blood cell (WBC) count suffers from a physiological blind spot:
-
Bone Marrow Mobilization Lag: It frequently takes 12 to 24 hours after bacterial invasion for bone marrow neutrophil production and demargination to push the peripheral WBC count above the normal reference range.
-
Wide Individual Baseline Variance: A normal human leukocyte count spans from 4.0 to 10.0 billion cells per liter. A patient whose healthy baseline is 4.2 billion cells per liter can double their white cell count to 8.4 billion during an acute bacterial infection and still appear completely “normal” on a routine hematology report.
-
Blunted Responses in Vulnerable Patients: Neonates, elderly patients, and immunocompromised oncology patients often fail to mount a leukocytosis response at all—or present with paradoxical leukopenia during severe gram-negative sepsis.
To close this diagnostic blind spot, clinical laboratories rely on Specific Protein Analyzers. Unlike general biochemistry analyzers that measure broad colorimetric total protein or albumin via the Biuret method, a specific protein analyzer uses highly targeted monospecific antibodies to lock onto individual functional proteins—such as C-Reactive Protein (CRP), Serum Amyloid A (SAA), Procalcitonin (PCT), Cystatin C, Glycated Hemoglobin (HbA1c), and Immunoglobulins—measuring their exact concentration in milligrams or nanograms per liter within minutes.
1. The Core Immunochemical Principle: Liquid-Phase Antigen-Antibody Complexation
Every test performed on a specific protein analyzer relies on the specificity of the humoral immune reaction. In this analytical setup, the target human protein inside the patient’s specimen acts as the Antigen (Ag), while the purified reagent dispensed by the analyzer contains high-affinity polyclonal or monoclonal Antibodies (Ab) engineered to bind exclusively to epitopes on that single protein.
Plaintext
               LIQUID-PHASE IMMUNE COMPLEX FORMATION & KINETICS
+-------------------------------------------------------------------------+
| STEP 1: Soluble Patient Protein (Antigen) + Specific Reagent Antibody   |
|         - Mixed inside an optical cuvette at 37.0 degrees Celsius       |
|                                   |                                     |
| STEP 2: Polyethylene Glycol (PEG) Reaction Acceleration                 |
|         - Hydrophilic PEG polymer excludes water molecules around       |
|           proteins, accelerating steric lattice cross-linking           |
|                                   |                                     |
| STEP 3: Suspended Micro-Precipitate Lattice Formation                   |
|         - Forms stable insoluble (Ag-Ab)n complexes (100 to 600 nm)     |
|         - Scatters and blocks incident monochromatic light beam         |
+-------------------------------------------------------------------------+
The Role of Polyethylene Glycol (PEG) Buffer
Left in plain saline buffer, soluble antigens and antibodies take 30 to 60 minutes to cross-link into a visible precipitate lattice. Modern specific protein analyzers compress this reaction time down to 60 to 180 seconds by introducing a reaction buffer containing Polyethylene Glycol (typically 3% to 4% PEG 6000).
PEG is a neutral, water-soluble polymer that binds surrounding water molecules (a physical mechanism called steric exclusion). By reducing the hydration shell around the patient’s proteins and reagent antibodies, PEG brings the macromolecules into immediate proximity, accelerating the formation of stable, suspended micro-precipitate complexes that interact with light.
The Heidelberger-Kendall Curve & The “High-Dose Hook Effect”
A fundamental law of immunochemistry dictates that the amount of insoluble immune complex formed is only proportional to the patient’s protein concentration when reagent antibodies are present in excess. This relationship follows the classic Heidelberger-Kendall precipitation curve, which divides into three distinct zones:
Plaintext
                     THE THREE ZONES OF IMMUNO-PRECIPITATION
+-------------------------------------------------------------------------+
| 1. ZONE OF ANTIBODY EXCESS (True Analytical Measurement Zone)           |
|    - Abundant reagent antibodies cross-link every patient protein.      |
|    - Optical scatter signal increases linearly with protein level.      |
|                                                                         |
| 2. ZONE OF EQUIVALENCE (Peak Lattice Cross-Linking)                     |
|    - Antigen and antibody binding sites are saturated at a 1:1 ratio.   |
|    - Maximum turbidity/scatter plateau is reached.                      |
|                                                                         |
| 3. ZONE OF ANTIGEN EXCESS (The Dangerous "Prozone / Hook Effect")       |
|    - Massive patient protein overload saturates individual antibodies.  |
|    - Only tiny 1:1 dimers form instead of large light-scattering grids. |
|    - Optical signal drops downward, mimicking a FALSE LOW concentration!|
+-------------------------------------------------------------------------+
-
Why Antigen Excess Matters Clinically: In conditions like multiple myeloma (where serum IgG or free light chains skyrocket to 10 times normal limits), severe bacterial sepsis (where CRP exceeds 300 mg/L), or nephrotic syndrome (where urinary microalbumin floods the sample), the massive excess of patient antigen prevents large cross-linked lattices from forming. If an analyzer only takes a single endpoint reading at the end of the reaction, a severely elevated pathological sample can produce a low optical signal—reporting a dangerous false-low or false-normal result.
-
Automated Kinetic Prozone Detection: Dedicated specific protein analyzers prevent this error through real-time kinetic rate monitoring. By sampling the optical detector multiple times per second from the moment the reagent hits the cuvette, the microprocessor analyzes the initial reaction velocity slope. An antigen-excess sample exhibits an explosive burst of complex formation in the first 3 to 5 seconds followed by rapid plateauing. When the software detects this characteristic kinetic signature (or conducts an automated small-volume pre-reaction check), it immediately flags “Antigen Excess / Hook Effect” and automatically triggers a 1:10 or 1:20 robotic sample dilution to bring the protein back into the linear Antibody Excess zone.
2. Optical Engineering: Immunonephelometry vs. Immunoturbidimetry vs. Latex Enhancement
Once the antigen-antibody micro-precipitates form inside the thermostated 37.0 degrees Celsius optical cuvette, the specific protein analyzer must convert their concentration into an electrical signal. Instrument engineering divides into two optical geometries—Immunonephelometry and Immunoturbidimetry—frequently paired with Latex Microparticle Enhancement.
Plaintext
                  OPTICAL DETECTOR GEOMETRY COMPARISON
+--------------------------------------------------------------------------------------+
|                                      [ Nephelometric Detector (90 deg) ]             |
|                                                      ^                               |
|                                                      | (Scattered Light)             |
| [ Laser / Cold LED Source ] ===> [ Reaction Cuvette ] ===> [ Turbidimetric Detector ]
|   (630 nm - 850 nm Beam)               |             (180 deg Transmitted Light)
|                                        v                                              |
|                        [ Forward Scatter Detector (13 - 70 deg) ]                     |
+---------------------------------------------------------------------------------------+
A. Immunoturbidimetry (Transmission / Absorbance Measurement)
In an immunoturbidimetric channel, the photodetector sits directly in line with the light source at a 180-degree angle (0-degree forward axis).
-
Physical Principle: As antigen-antibody complexes form and cloud the liquid, they block and scatter a portion of the incident light beam. The detector measures the attenuation (reduction) in transmitted light intensity, calculating Optical Density (OD) following an adaptation of the Beer-Lambert law.
-
Best Clinical Fit: Because turbidimetry measures a small drop against a bright baseline light beam, it works best for medium-to-high concentration plasma proteins—such as Hemoglobin A1c (HbA1c), Immunoglobulins (IgG, IgA, IgM), Complement C3/C4, Transferrin, and Haptoglobin—where dense precipitate clouds produce a strong absorbance shift.
B. Immunonephelometry (Forward & Right-Angle Light Scattering)
In an immunonephelometric system, the photodetector is positioned off-axis—typically at a forward angle of 13 to 70 degrees or a perpendicular angle of 90 degrees relative to the incident laser or LED beam.
-
Physical Principle: When the reaction cuvette contains clear buffer with zero immune complexes, the incident light beam passes straight through into a light trap, and the off-axis nephelometric detector sees complete darkness (zero baseline signal). The moment antigen-antibody complexes form, they deflect photons outward (via Rayleigh and Mie light scattering) directly into the off-axis photodiode.
-
Why Nephelometry Excels at Low Concentrations: In optical physics, measuring a faint flash of scattered light against a pitch-black background yields a much higher Signal-to-Noise Ratio (SNR) than trying to measure a tiny 0.1% dip in a blindingly bright transmitted beam. Consequently, nephelometry is the gold standard for quantifying low-concentration and trace proteins such as urinary microalbumin, Cystatin C, free immunoglobulin light chains, beta-2 microglobulin, and high-sensitivity CRP.
-
Rate Nephelometry vs. Fixed-Time Nephelometry: Advanced analyzers use Rate (Kinetic) Nephelometry, which calculates the maximum rate of change in scattered light intensity per second ($dI/dt$) rather than waiting for an endpoint plateau. Rate nephelometry delivers accurate results in 30 to 90 seconds and automatically cancels out static background scatter from lipemic or icteric patient serum.
C. Latex-Enhanced Immunonephelometry & Immunoturbidimetry
What happens when a clinical laboratory needs to measure a critical biomarker present at trace nanogram-per-milliliter concentrations—such as Procalcitonin (PCT), D-Dimer, High-Sensitivity CRP (hs-CRP), or Serum Amyloid A (SAA)—where native protein molecules are too small and scarce to scatter enough light on their own?
Engineers solved this by introducing Latex-Enhanced Reagents:
-
Sub-Micron Polystyrene Microspheres: Monoclonal antibodies are covalently bonded onto the surface of uniform, spherical polystyrene latex nanoparticles measuring 80 to 300 nanometers in diameter ( carefully sized to approach the wavelength of the analyzer’s red/near-infrared laser light).
-
Optical Signal Amplification: When a trace patient protein molecule binds to two latex-bound antibodies, it bridges the polystyrene spheres together into large aggregates. Because the refractive index and cross-sectional surface area of the latex beads are orders of magnitude larger than bare protein molecules, the scattered light signal is amplified 10-fold to 100-fold.
-
Hybrid Dual-Optic Analyzers: The most versatile modern specific protein analyzers combine both a nephelometric scatter detector and a turbidimetric transmission detector around the same cuvette (or integrate latex-enhanced kinetic algorithms). This allows the instrument to achieve a wide dynamic linear range—for example, measuring Full-Range CRP (fr-CRP) seamlessly from 0.2 mg/L (cardiovascular hs-CRP range) all the way up to 350 mg/L (severe bacterial sepsis range) in a single run without manual re-testing.
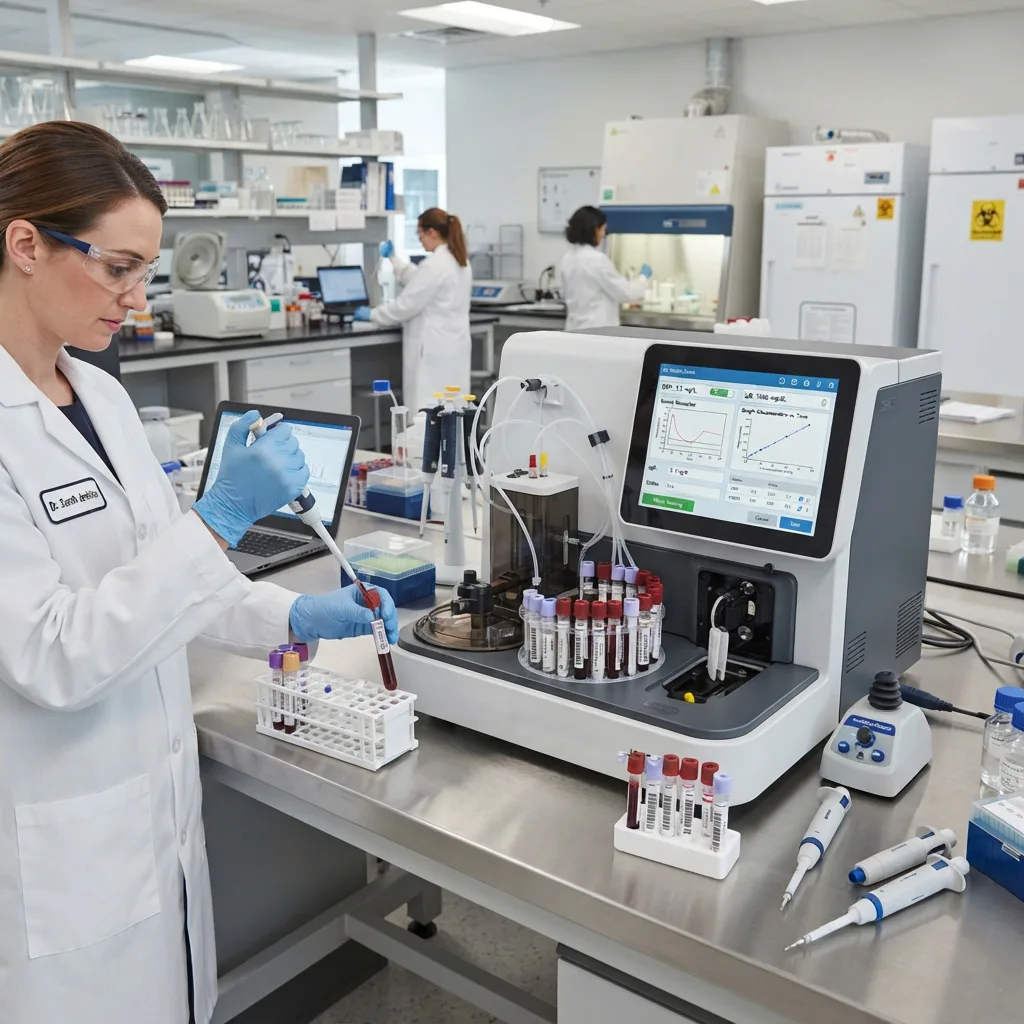
A clinical laboratory technician carefully preparing and pipetting patient blood samples for precise testing in a medical biochemistry analyzer.
Engineering Comparison: Turbidimetry vs. Rate Nephelometry vs. Latex-Enhanced Systems
| Optical & Analytical Feature | Standard Immunoturbidimetry | Rate Immunonephelometry | Latex-Enhanced Hybrid System |
| Detector Angle | 180 degrees (Direct line of sight) | 13 to 90 degrees (Off-axis scatter) | Dual-angle (Scatter + Transmission) |
| Optical Baseline | High brightness (100% transmittance) | Dark background (Near-zero scatter) | Dynamic auto-switching baseline |
| Analytical Sensitivity | Moderate (Milligram per liter range) | High (Sub-milligram per liter range) | Ultra-High (Nanogram to mg/L range) |
| Typical Reaction Time | 3 to 5 minutes (Endpoint/Two-point) | 1 to 2 minutes (Kinetic slope) | 45 to 120 seconds (Rapid kinetic) |
| Prozone Hook Resistance | Moderate (Requires 2-point check) | High (Continuous rate slope check) | Very High (Kinetic + dual-detector) |
| Primary Biomarker Fit | HbA1c, IgG, IgA, IgM, C3, C4, TRF | Urinary mALB, IgE, Free Light Chains | CRP/hs-CRP, SAA, PCT, Cys-C, D-Dimer |
3. The Four Core Clinical Biomarker Panels: Diagnostic Applications Explained
A hospital or outpatient laboratory invests in a specific protein analyzer because of its broad clinical menu. By switching reagent cartridges, a single analyzer serves the Emergency Department, Pediatrics, Endocrinology, Nephrology, Rheumatology, and Cardiology.
               THE FOUR CLINICAL PILLARS OF SPECIFIC PROTEIN TESTING
+-------------------------------------------------------------------------+
| 1. INFECTION & SEPSIS      --> CRP, hs-CRP, SAA, PCT, AAT, AAG          |
| 2. DIABETES & NEPHROLOGY   --> HbA1c, Cystatin C, mALB, BMG, AMG, RBP   |
| 3. RHEUMATOLOGY & IMMUNITY --> RF, ASO, Anti-CCP, IgG/A/M/E, C3, C4     |
| 4. CARDIO, COAG & NUTRITION--> D-Dimer, ApoA1, ApoB, Lp(a), Prealbumin  |
+-------------------------------------------------------------------------+
Panel 1: Acute Inflammation, Sepsis & Antibiotic Stewardship (CRP, SAA, PCT)
In fever clinics, pediatric wards, and emergency rooms, differentiating between bacterial and viral infections is the single highest-volume application for specific protein analyzers.
1. C-Reactive Protein (CRP) & Full-Range CRP (fr-CRP)
Synthesized by hepatocytes in the liver under the stimulation of Interleukin-6 (IL-6), CRP is a pentameric acute-phase protein that binds to phosphocholine expressed on the surface of dead or dying host cells and bacterial cell walls, activating the classical complement cascade.
-
Normal Baseline: Less than 3.0 to 5.0 mg/L in healthy adults.
-
Bacterial vs. Viral Response: During acute invasive bacterial infections (such as bacterial pneumonia, pyelonephritis, or meningitis), CRP levels rise within 4 to 6 hours and surge to 40 to 300+ mg/L within 24 to 48 hours. In contrast, uncomplicated viral infections generally leave CRP normal or mildly elevated (typically between 5 and 20 mg/L).
-
Monitoring Antibiotic Efficacy: Because CRP has a constant biological half-life of approximately 19 hours regardless of renal or hepatic function, a 50% drop in CRP concentration 24 hours after starting empiric antibiotics provides objective proof that the infection is responding to treatment.
2. Serum Amyloid A (SAA): The Essential Viral Counterpart to CRP
If CRP remains normal or borderline (for example, 8 mg/L) in a febrile child, does the patient have a viral infection or an early bacterial infection? CRP alone cannot always distinguish between a viral upper respiratory infection and healthy baseline. Serum Amyloid A (SAA) solves this puzzle:
-
Kinetics: Like CRP, SAA is an acute-phase apolipoprotein synthesized in the liver, with a normal reference cutoff of less than 10 mg/L. However, unlike CRP, SAA surges dramatically (often 100-fold to 1,000-fold) during BOTH acute viral infections (influenza, adenovirus, rotavirus, hand-foot-and-mouth disease, COVID-19) AND bacterial infections.
-
The Combined CRP + SAA Diagnostic Matrix: Running CRP and SAA simultaneously from a single fingerstick blood sample gives clinicians a clear decision matrix:
| Combined Biomarker Profile | CRP Level | SAA Level | SAA / CRP Ratio | Clinical Interpretation & Antibiotic Guidance |
| Pattern 1: Normal / Non-Infectious | Normal (less than 10 mg/L) | Normal (less than 10 mg/L) | Low | Rules out systemic acute bacterial or viral inflammation. |
| Pattern 2: Acute Viral Infection | Normal or Mild (less than 20 mg/L) | Markedly Elevated (50 to 500+ mg/L) | High Ratio | Viral etiology confirmed. Withhold unnecessary antibiotics; provide supportive/antiviral care. |
| Pattern 3: Acute Bacterial Infection | Markedly Elevated (40 to 300+ mg/L) | Markedly Elevated (100 to 1,000+ mg/L) | Low to Moderate | Bacterial infection confirmed. Initiate targeted antibiotic therapy immediately. |
| Pattern 4: Recovery Phase | Declining slowly (19-hr half-life) | Drops rapidly (Shorter half-life) | Declining | Confirms rapid resolution of acute inflammation prior to hospital discharge. |
3. Procalcitonin (PCT)
Normally produced only by thyroid C-cells at trace levels (less than 0.05 ng/mL), Procalcitonin is released ubiquitously by parenchymal tissues throughout the body in response to bacterial endotoxins (lipopolysaccharide) and pro-inflammatory cytokines, while its synthesis is actively blocked by Interferon-gamma released during viral infections.
-
Clinical Cutoffs: A PCT between 0.5 and 2.0 ng/mL indicates a high risk of systemic bacterial infection; a PCT greater than 2.0 ng/mL (and especially greater than 10.0 ng/mL) is a specific hallmark of severe bacterial sepsis and septic shock.
Panel 2: Diabetes Control & Early Renal Injury (HbA1c, Cystatin C, Microalbumin)
Chronic Kidney Disease (CKD) and Diabetes Mellitus represent a massive global disease burden where early intervention prevents dialysis and cardiovascular mortality.
1. Glycated Hemoglobin (HbA1c) via Direct Immunoturbidimetry
HbA1c forms via the non-enzymatic glycation of the N-terminal valine residue of the hemoglobin beta chain, reflecting a patient’s average blood glucose over the preceding 8 to 12 weeks (the 120-day lifespan of erythrocytes).
-
How Specific Protein Analyzers Measure HbA1c: Advanced analyzers utilize a Direct Latex-Enhanced Immunoturbidimetric Method. In the first phase, total hemoglobin and HbA1c compete Equally on unquoted latex particle surfaces in exact proportion to their percentages in the lysed whole blood sample. In the second phase, mouse anti-human HbA1c monoclonal antibodies cross-link only the HbA1c-bound latex beads. Because the absorbance is directly proportional to the percentage of glycated hemoglobin, the analyzer calculates % HbA1c (NGSP) and mmol/mol (IFCC) in a single reaction cuvette without needing a separate total hemoglobin test channel.
2. Cystatin C (Cys-C): Breaking Through the “Creatinine-Blind Area”
For decades, doctors relied on serum creatinine to estimate kidney filtration (eGFR). However, serum creatinine has two major clinical flaws: (1) it is a byproduct of skeletal muscle metabolism, meaning elderly patients, malnourished patients, women, and young children have naturally low creatinine that masks renal failure; and (2) due to renal tubular secretion reserve, serum creatinine does not rise above the normal upper limit until more than 50% of the kidney’s nephrons are already destroyed—a diagnostic dead zone known as the “creatinine-blind area” (GFR between 40 and 80 mL/min/1.73m2).
               SERUM CREATININE vs. CYSTATIN C SENSITIVITY CURVE
+-------------------------------------------------------------------------+
| Normal GFR (90 to 120 mL/min)                                           |
|   - Serum Creatinine: Normal        | Serum Cystatin C: Normal          |
|                                     |                                   |
| Early Renal Decline ("Creatinine-Blind Zone": GFR 45 to 80 mL/min)      |
|   - Serum Creatinine: STILL NORMAL! | Serum Cystatin C: RISES SHARPLY!  |
|     (Misses early kidney damage)    |   (Flags early glomerular injury) |
|                                     |                                   |
| Advanced Renal Failure (GFR below 30 mL/min)                            |
|   - Both Serum Creatinine and Cystatin C are markedly elevated          |
+-------------------------------------------------------------------------+
-
Why Cystatin C Is Superior: Cystatin C is a low-molecular-weight (13.3 kDa) cysteine protease inhibitor produced at a constant rate by all nucleated cells in the human body. It is unaffected by muscle mass, sex, age, diet, or inflammatory status. It is freely filtered by the renal glomeruli and completely reabsorbed and catabolized by the proximal tubules without ever returning to the bloodstream. Consequently, even a mild 15% drop in glomerular filtration causes serum Cystatin C (normal range roughly 0.55 to 1.05 mg/L) to rise immediately.
3. Anatomical Localization of Nephron Damage: Glomerular vs. Tubular Proteins
By testing a spot urine specimen for four specific urinary proteins on a nephelometric analyzer, nephrologists can pinpoint the exact anatomical site of kidney damage without an invasive renal biopsy:
-
Urinary Microalbumin (mALB, 66 kDa) & Urinary Transferrin (TRU, 76 kDa): Medium-sized negatively charged proteins. Their elevation (mALB between 20 and 200 mg/L) proves early glomerular charge-barrier and size-barrier damage (incipient diabetic or hypertensive nephropathy).
-
Urinary Immunoglobulin G (uIgG, 150 kDa): A large macromolecule. Its presence in urine alongside albumin indicates non-selective, severe structural disruption of the glomerular basement membrane.
-
Alpha-1 Microglobulin (AMG, 27 kDa), Beta-2 Microglobulin (BMG, 11.8 kDa) & Retinol-Binding Protein (RBP, 21 kDa): Low-molecular-weight proteins that normally pass freely through healthy glomeruli and are 99.9% reabsorbed by healthy proximal renal tubules. Elevated urinary AMG, BMG, or RBP confirms proximal renal tubular dysfunction (caused by heavy metal toxicity, aminoglycoside antibiotics, analgesic nephropathy, or renal transplant rejection). (Note: Alpha-1 Microglobulin is clinically preferred over Beta-2 Microglobulin for routine urine testing because AMG remains stable in acidic urine down to pH 4.0, whereas BMG degrades if urinary pH drops below 5.5).
Panel 3: Rheumatology, Autoimmune Disease & Humoral Immunity
Specific protein analyzers serve as the core workhorse for immunology and rheumatology outpatient clinics, replacing slow manual latex agglutination slide tests and radial immunodiffusion (RID) agar plates.
-
Rheumatoid Factor (RF): Quantifies autoantibodies (predominantly IgM isotype) directed against the Fc portion of human IgG. Moving from qualitative manual slide agglutination (“Positive/Negative”) to quantitative nephelometry/turbidimetry (reporting exact IU/mL, normal cutoff under 14 to 20 IU/mL) allows rheumatologists to track Rheumatoid Arthritis disease severity and response to disease-modifying antirheumatic drugs (DMARDs).
-
Anti-Streptolysin O (ASO): Measures neutralizing antibodies produced against streptolysin O, an oxygen-labile hemolytic toxin secreted by Group A beta-hemolytic Streptococcus (Streptococcus pyogenes). Quantitative ASO titers (normal adult cutoff under 200 IU/mL) confirm antecedent streptococcal infection in patients presenting with acute rheumatic fever, post-streptococcal glomerulonephritis, or erythema nodosum.
-
Anti-Cyclic Citrullinated Peptide (Anti-CCP): Detects autoantibodies targeting citrullinated synovial proteins. While RF can be positive in other infections or healthy elderly individuals, Anti-CCP offers over 95% clinical specificity for Rheumatoid Arthritis and often turns positive years before joint erosion appears on X-rays.
-
Quantitative Immunoglobulins (IgG, IgA, IgM, IgE) & Free Light Chains (Kappa / Lambda): Evaluates humoral B-cell immunity. Low levels identify congenital or acquired immunodeficiencies, while polyclonal elevations signal chronic liver cirrhosis or autoimmune hepatitis. Disproportionate elevation of a single class or an abnormal Serum Free Kappa-to-Lambda Light Chain Ratio (normal ratio 0.26 to 1.65) detects Multiple Myeloma, Waldenstrom macroglobulinemia, and AL amyloidosis.
-
Complement Components C3 and C4: Measures key enzymatic proteins of the innate immune complement cascade. Active consumption (resulting in depressed serum C3 and C4 levels) signals an acute flare of Systemic Lupus Erythematosus (SLE), membranoproliferative glomerulonephritis, or post-infectious nephritis.
Panel 4: Cardiovascular Risk, Thrombosis & Nutritional Status
-
High-Sensitivity CRP (hs-CRP): Uses ultra-sensitive latex-enhanced nephelometry to measure trace vascular inflammation inside coronary arterial plaques:
-
Less than 1.0 mg/L: Low cardiovascular risk.
-
1.0 to 3.0 mg/L: Moderate cardiovascular risk.
-
Greater than 3.0 mg/L (up to 10.0 mg/L): High risk of future myocardial infarction or ischemic stroke due to unstable atherosclerotic plaque vulnerability.
-
-
D-Dimer: A specific cross-linked fibrin degradation fragment generated when endogenous plasmin breaks down an active intravascular blood clot. A quantitative latex-enhanced D-Dimer result below 0.50 mg/L FEU (Fibrinogen Equivalent Units) rules out Deep Vein Thrombosis (DVT) and Pulmonary Embolism (PE) with a Negative Predictive Value exceeding 99% in low-to-moderate risk emergency patients, and monitors Disseminated Intravascular Coagulation (DIC).
-
Apolipoprotein A1 (ApoA1), Apolipoprotein B (ApoB) & Lipoprotein(a) [Lp(a)]: ApoA1 is the primary structural protein of protective HDL (“good”) cholesterol, whereas exactly one molecule of ApoB resides on every atherogenic LDL, VLDL, and IDL particle. The ApoB-to-ApoA1 ratio is widely recognized by cardiologists as a more accurate predictor of coronary artery disease than standard LDL cholesterol calculations. Meanwhile, Lp(a) is an independent, genetically determined risk factor for premature heart attacks and aortic valve stenosis.
-
Prealbumin (PAB / Transthyretin) & Retinol-Binding Protein (RBP): While serum albumin has a long 20-day half-life (making it slow to reflect acute starvation), Prealbumin has a biological half-life of just 1.9 to 2.0 days. Measuring Prealbumin on a specific protein analyzer provides ICU physicians, burn units, and surgical oncology teams with a real-time barometer of protein-calorie malnutrition and parenteral nutrition recovery.
4. Reference Matrix: 20 Essential Specific Protein Biomarkers at a Glance
Use this clinical quick-reference matrix to compare testing methods, specimen types, typical reference intervals, and primary diagnostic applications:
| Biomarker Name | Abbr. | Preferred Optical Method | Specimen Type | Typical Healthy Reference Range | Primary Clinical Indication |
| C-Reactive Protein | CRP | Latex Nephelometry / Turbidimetry | Whole Blood / Serum | Less than 5.0 mg/L | Acute bacterial infection, tissue trauma, postoperative sepsis monitoring. |
| High-Sensitivity CRP | hs-CRP | Latex Nephelometry | Whole Blood / Serum | Less than 1.0 mg/L (Low CV Risk) | Coronary artery atherosclerosis & myocardial infarction risk stratification. |
| Serum Amyloid A | SAA | Latex Nephelometry / Turbidimetry | Whole Blood / Serum | Less than 10.0 mg/L | Viral vs. bacterial fever triage; early infection & transplant rejection. |
| Procalcitonin | PCT | Latex-Enhanced Optical | Serum / Plasma / WB | Less than 0.05 ng/mL | Systemic bacterial sepsis, septic shock & ICU antibiotic de-escalation. |
| Glycated Hemoglobin | HbA1c | Direct Latex Turbidimetry | EDTA Whole Blood | 4.0% – 6.0% (20–42 mmol/mol) | Long-term (8–12 week) glycemic control in Diabetes Mellitus. |
| Cystatin C | Cys-C | Latex Nephelometry / Turbidimetry | Serum / Plasma | 0.55 – 1.05 mg/L | Early glomerular filtration rate (eGFR) loss in the creatinine-blind zone. |
| Urinary Microalbumin | mALB | Immunonephelometry / Turbidimetry | Spot or 24h Urine | Less than 20 mg/L (or ACR under 30 mg/g) | Earliest reversible detection of diabetic and hypertensive nephropathy. |
| Beta-2 Microglobulin | BMG | Latex Nephelometry | Serum or Urine | Serum: 1.0–2.4 mg/L; Urine: under 0.3 mg/L | Renal proximal tubular injury (urine); Multiple myeloma tumor burden (serum). |
| Alpha-1 Microglobulin | AMG | Immunonephelometry | Spot Urine | Less than 12.0 mg/L | Acid-stable marker of early renal proximal tubular dysfunction & heavy metals. |
| Rheumatoid Factor | RF | Latex Turbidimetry / Nephelometry | Serum | Less than 14 – 20 IU/mL | Diagnosis and activity tracking of Rheumatoid Arthritis & Sjogren syndrome. |
| Anti-Streptolysin O | ASO | Latex Turbidimetry / Nephelometry | Serum | Adults: under 200 IU/mL | Confirms Group A Streptococcal infection in rheumatic fever & nephritis. |
| Anti-CCP Antibody | CCP | Latex-Enhanced Optical | Serum | Less than 20 – 25 U/mL | High-specificity early detection of erosive Rheumatoid Arthritis. |
| Immunoglobulin G | IgG | Immunoturbidimetry / Nephelometry | Serum | 7.0 – 16.0 g/L | Humoral immunity status, chronic infections, multiple myeloma & autoimmune liver disease. |
| Immunoglobulin A | IgA | Immunoturbidimetry / Nephelometry | Serum | 0.7 – 4.0 g/L | Mucosal immunity, IgA nephropathy, celiac disease & cirrhosis. |
| Immunoglobulin M | IgM | Immunoturbidimetry / Nephelometry | Serum | 0.4 – 2.3 g/L | Acute primary humoral immune response & Waldenstrom macroglobulinemia. |
| Complement C3 | C3 | Immunoturbidimetry / Nephelometry | Serum | 0.90 – 1.80 g/L | Innate immune activation; depressed in active SLE lupus nephritis flares. |
| Complement C4 | C4 | Immunoturbidimetry / Nephelometry | Serum | 0.10 – 0.40 g/L | Classical complement pathway consumption in lupus and hereditary angioedema. |
| D-Dimer | DD | Latex-Enhanced Nephelometry | Citrated Plasma / WB | Less than 0.50 mg/L FEU | Exclusion of Deep Vein Thrombosis (DVT), Pulmonary Embolism (PE) & DIC. |
| Prealbumin | PAB | Immunoturbidimetry / Nephelometry | Serum | 200 – 400 mg/L | Rapid 2-day half-life indicator of acute protein-calorie malnutrition & liver synthesis. |
| Lipoprotein(a) | Lp(a) | Latex Immunoturbidimetry | Serum | Less than 300 mg/L (or under 75 nmol/L) | Genetically inherited risk factor for premature coronary artery disease & stroke. |
5. Overcoming Analytical Interferences: Lipemia, Hemolysis, and Heterophilic Antibodies
In real-world hospital operations, patient specimens are rarely pristine. To guarantee clinical reliability, specific protein analyzers deploy specialized optical and chemical safeguards against three major biological interferences:
-
Lipemia (Chylomicrons and Triglycerides): Milky, hypertriglyceridemic serum contains large lipid droplets (100 to 1,000 nanometers) that strongly scatter light across all angles, artificially inflating static turbidimetric readings. Modern specific protein analyzers neutralize lipemia by (a) incorporating non-ionic surfactant clearing buffers into Reagent 1 (R1), (b) subtracting a pre-reaction optical blank reading taken after Sample + R1 mixing before the antibody Reagent 2 (R2) is added, and (c) utilizing kinetic rate nephelometry, where static lipid droplets contribute zero change to the dynamic reaction slope ($dI/dt$).
-
Hemolysis and Whole Blood Hematocrit (HCT): When testing whole blood directly for CRP or SAA without centrifugation, intact red blood cells occupy roughly 35% to 50% of the aspirated volume, while the target proteins reside exclusively in the liquid plasma fraction. If an analyzer ignores hematocrit, a severely anemic patient (HCT 20%) and a polycythemic neonate (HCT 60%) will yield skewed plasma protein concentrations. Advanced specific protein analyzers automatically lyse red blood cells using a saponin hemolyzing reagent, measure the liberated hemoglobin concentration optically inside the same cuvette, calculate the patient’s exact Hematocrit (HCT %), and mathematically correct the reported CRP/SAA value to match centrifuged serum results.
-
Endogenous Rheumatoid Factor & Heterophilic Antibodies (HAMA): Patients with autoimmune disorders or prior animal exposure often carry endogenous IgM Rheumatoid Factor or Human Anti-Mouse Antibodies (HAMA) that bind nonspecifically to the constant Fc tail region of animal reagent antibodies, bridging latex beads together and causing false-positive results. High-grade specific protein reagents prevent this by enzymatically cleaving off the Fc tail of the reagent antibodies—utilizing only purified F(ab’)2 divalent antigen-binding fragments alongside mouse IgG blocking proteins in the buffer.
Frequently Asked Questions (FAQ)
Q1: Why use a dedicated Specific Protein Analyzer instead of running protein tests on a general clinical chemistry analyzer?
While large floor-standing biochemistry analyzers can run basic immunoturbidimetric assays, they have three major limitations compared to a dedicated specific protein analyzer:
-
No Whole Blood Cap-Piercing: Biochemistry analyzers require centrifuged serum or plasma (adding 15 to 20 minutes of clotting and centrifuge wait time), whereas specific protein analyzers can aspirate EDTA whole blood directly through the closed cap for STAT CRP, SAA, and HbA1c results in under 3 minutes.
-
No Off-Axis Nephelometric Optics: Biochemistry analyzers only possess 180-degree transmission photometers, meaning they lack the forward-scatter nephelometric sensitivity required for trace proteins unless expensive latex reagents are used.
-
Latex Cuvette Fouling: Running sticky latex-enhanced protein reagents inside the reaction cuvettes of a general biochemistry analyzer can leave residual polystyrene-protein biofilms on the optical windows that interfere with subsequent routine electrolyte or liver enzyme tests.
Q2: What is the difference between conventional CRP, hs-CRP, and Full-Range CRP (fr-CRP)?
All three tests measure the exact same C-Reactive Protein molecule; the difference lies entirely in the analytical measuring range and clinical application:
-
Conventional CRP measures from roughly 5.0 to 200+ mg/L to evaluate acute bacterial infections, surgical trauma, and autoimmune flares.
-
High-Sensitivity CRP (hs-CRP) uses amplified latex nephelometry to measure trace baseline inflammation between 0.1 and 10.0 mg/L, assessing chronic vascular endothelial inflammation for cardiovascular risk stratification.
-
Full-Range CRP (fr-CRP) combines dual-angle optical detectors or variable-size latex microparticles to span the entire spectrum from 0.2 mg/L up to 350 mg/L in a single test, satisfying both cardiology and emergency infectious disease clinicians with one reagent kit.
Q3: Why can HbA1c results be unreliable in patients with hemolytic anemia or hemoglobinopathies?
Because the HbA1c percentage depends on the average 120-day lifespan of circulating red blood cells, any clinical condition that shortens erythrocyte survival—such as hemolytic anemia, acute blood loss, splenomegaly, or recent blood transfusions—leaves red blood cells exposed to blood glucose for fewer days, resulting in a falsely low HbA1c reading regardless of the analyzer method. In these patients, measuring Glycated Albumin (GA) or Fructosamine (which reflects a shorter 2-to-3-week glycemic window based on serum protein turnover) provides an accurate alternative.
Q4: How do specific protein analyzers handle calibration curves for dozens of different biomarkers?
Unlike simple colorimetric chemistry tests that follow a linear single-point factor, antigen-antibody precipitation follows a non-linear sigmoidal curve requiring a 5-to-6-point multi-calibrator spline or logit-log curve. To save laboratories the high cost and labor of running six liquid calibrators every time a new reagent kit is opened, modern specific protein analyzers provide factory master-calibrated RFID cards or 2D QR barcodes inside every reagent box. Scanning the card uploads the exact lot-specific 6-point mathematical curve in one second, requiring only daily bi-level liquid Quality Control (QC) verification.
Q5: Why should a laboratory test both Urinary Microalbumin and Urinary Creatinine (ACR) on a spot urine sample?
The raw concentration of microalbumin in a random daytime urine cup (measured in mg/L) fluctuates wildly depending on water intake: drinking a liter of water dilutes the urine and can push an abnormal microalbumin level below the 20 mg/L cutoff, while morning dehydration concentrates the urine and can trigger a false positive. Because creatinine is excreted into urine at a steady daily rate, dividing urinary microalbumin by urinary creatinine to report the Albumin-to-Creatinine Ratio (ACR, normal under 30 mg/g) eliminates hydration bias and spares the patient an inconvenient 24-hour timed urine collection.
Specific protein analyzers bridge the gap between rapid point-of-care emergency triage and deep immunological profiling. By combining kinetic rate immunonephelometry, immunoturbidimetry, and latex-enhanced optical amplification with automated antigen-excess prozone protection, these instruments empower clinicians to distinguish viral from bacterial fevers in minutes, catch early kidney injury inside the creatinine-blind zone, and manage chronic autoimmune and metabolic disorders with quantitative precision.